01 / YOUR PLANNING FOUNDATION
Configurable Models
Design, configure, and maintain flexible financial and operational planning models
Talk to an expert
From the first connection to the next decision.
Everything that moves your planning forward.

More information.
Less perspective.
Manual spreadsheets, disconnected systems, and outdated planning tools leave teams reconciling the past instead of preparing for what comes next.
Disconnected financial spreadsheets and reporting systems.
Conflicting financial forecasts and inconsistent KPIs.
Isolated sales, finance, operations, and supply chain datasets.
Multiple financial dashboards that fail to provide a unified business perspective.
Delayed financial reporting and unpredictable cash flow.
Uncertainty surrounding critical investment and business decisions.

Move beyond fragmented planning. Connect financial intelligence, operational reality, and strategic foresight in one integrated environment.
AURORA / THE PLATFORM
01–06 / CORE BENEFITS
One Connected Financial Truth.
Gain a comprehensive view of financial health by connecting income statements, balance sheets, and cash flows—transforming fragmented information into clarity, confidence, and better-informed decisions.
Anticipate What Comes Next.
Turn historical performance into forward-looking intelligence. Identify emerging trends, anticipate financial challenges, and prepare your business for opportunities before they unfold.
Explore Possibilities. Decide with Confidence.
Go beyond assumptions. Simulate alternative business scenarios, evaluate their financial implications, and understand the potential impact of strategic decisions before committing resources.
Discover What Drives Value.
Move beyond traditional reporting. Uncover the financial drivers behind business performance, identify opportunities for improvement, and transform complex data into actionable strategic intelligence.
Every Insight. One Executive View.
Bring critical financial indicators into a unified, intuitive experience. Monitor what matters, recognize performance shifts, and maintain the visibility needed to lead with precision.
Measure Performance. Maximize Value.
Connect profitability, capital efficiency, and investment returns to strategic priorities. Evaluate financial outcomes, optimize resource allocation, and focus decisions on sustainable value creation.
Design, configure, and maintain flexible financial and operational planning models
Talk to an expertEvaluate alternative business conditions and quantify their financial implications
Connect financial and operational data from enterprise systems
Improve forecasting, identify patterns, and support predictive decision-making
Support complex planning models, large datasets, and enterprise workloads
Connect financial plans with operational and strategic business activities
Deliver performance visibility, management reporting, and actionable insights
Address multinational planning requirements and relevant regulatory obligations
A clearer perspective on financial and operational planning. Bring your next decision into focus, and move forward with confidence.
AURORA / CONTACT
Talk with us about how Aurora can support your financial planning, forecasting, and decision‑making.
Start with a perspective that spans financial and operational planning.
Make space for the questions, assumptions, and possibilities behind every plan.
Bring clarity to the conversation around your next decision.
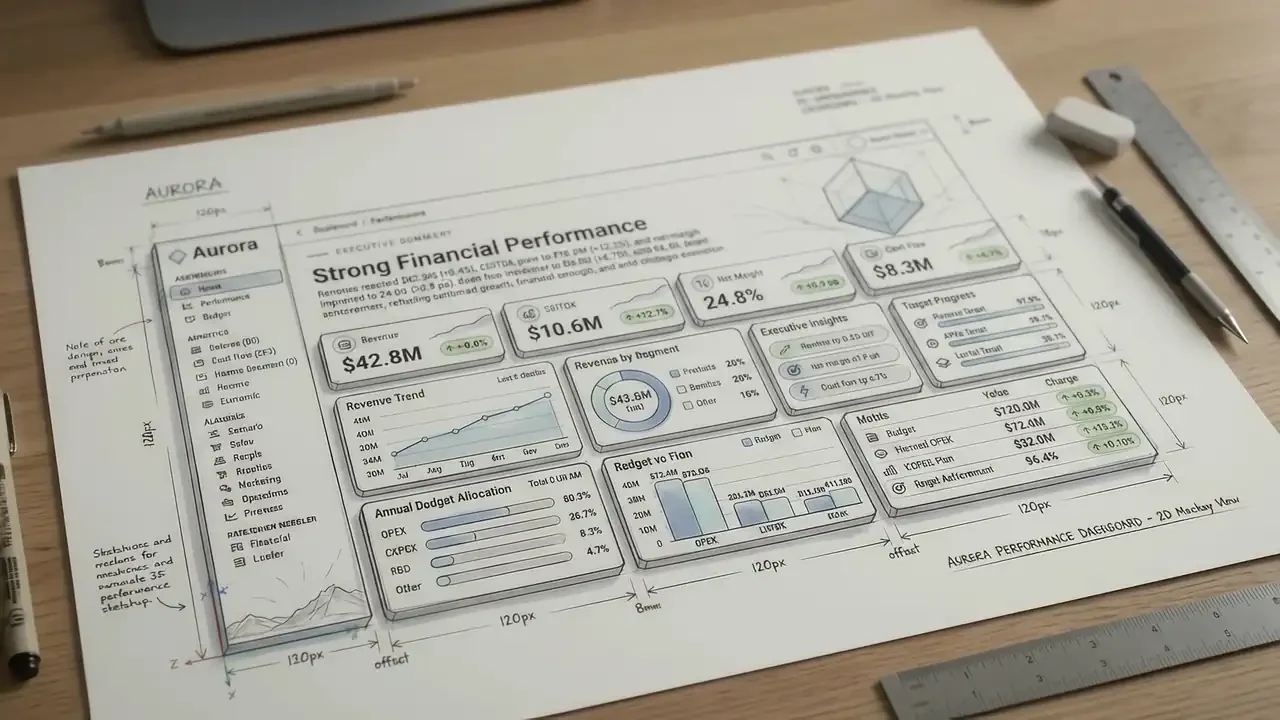
A preview of the AURORA platform concept.
Use process effort, cost, and device readiness to guide staffing, automation, and investment.
The work behind
the result.
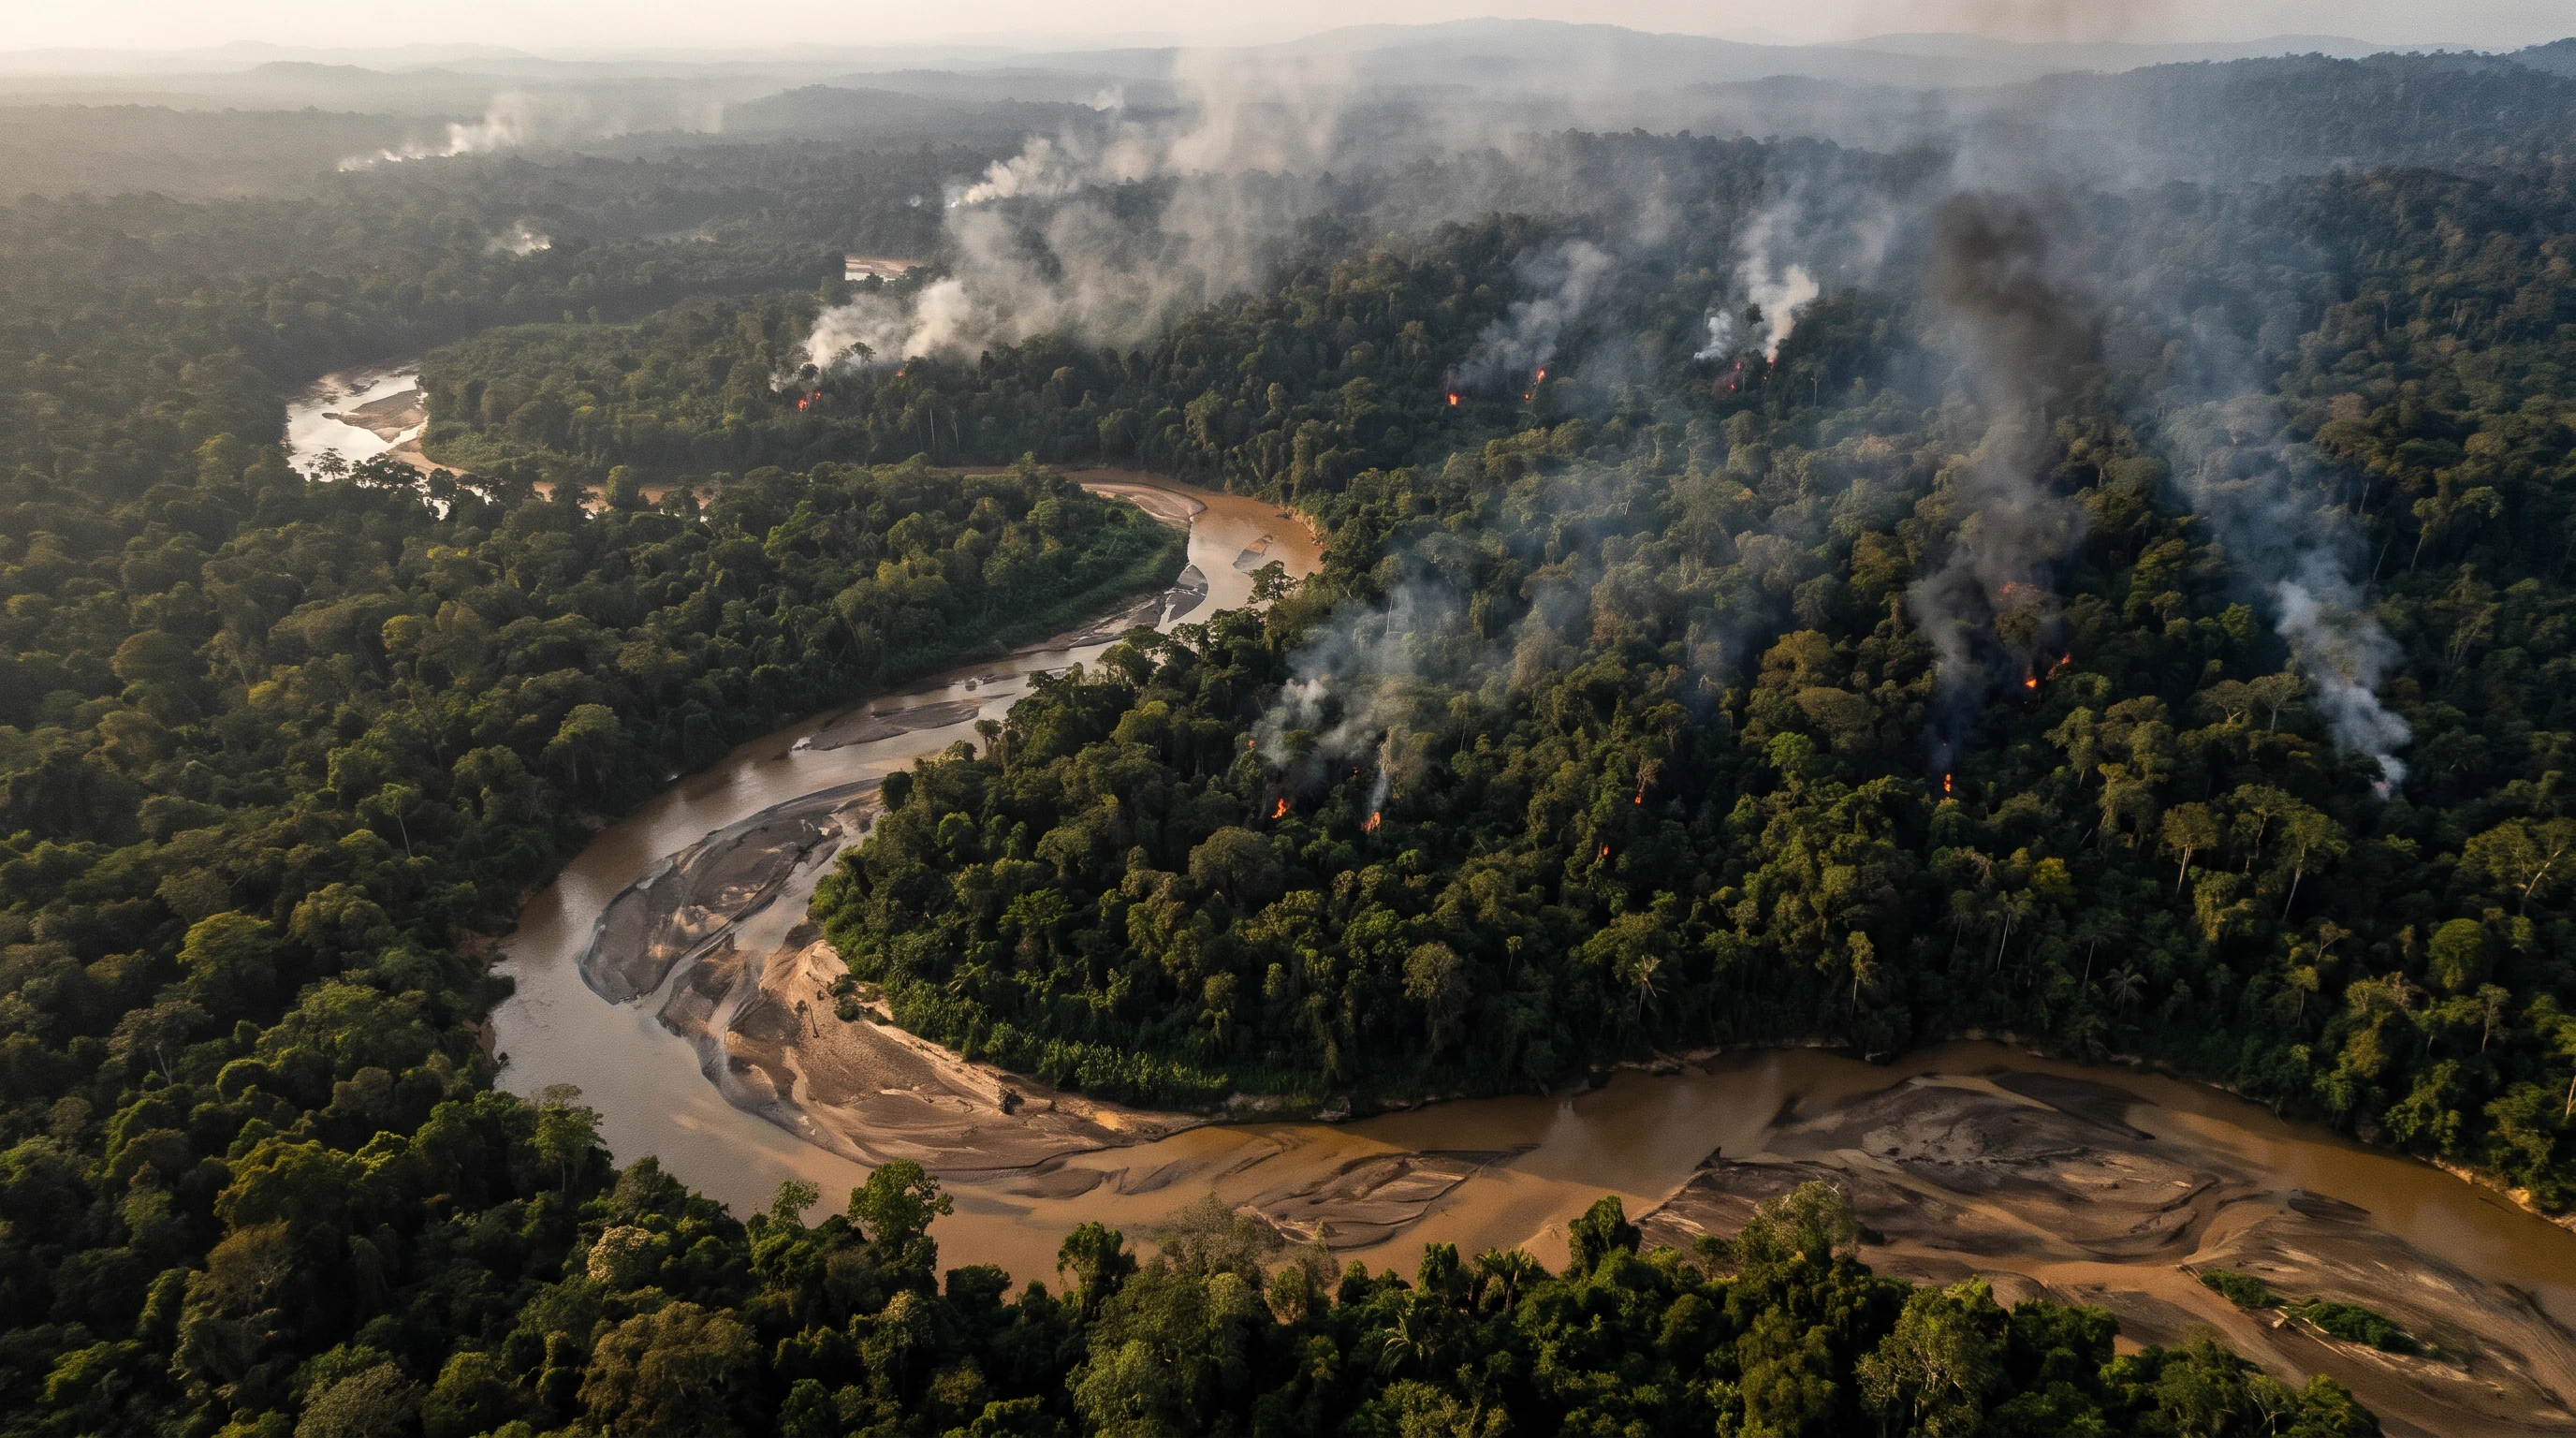
Operational indicators show where performance is changing. Understanding why takes a closer look at how people, processes, and technology shape the work. That depth helps leaders decide where investment can address the underlying cause.
Connect changes in performance to the work steps and handoffs behind them.
Distinguish capacity limits from delays caused by process design or tools.
Estimate the time, staffing, and cost each process requires before sizing an investment.
Compare process redesign, automation, and staffing against the same operational goals.
Assess whether current devices and applications can support the proposed change.
Set a baseline and define how to measure the impact of each investment.

02 / THE BENEFIT
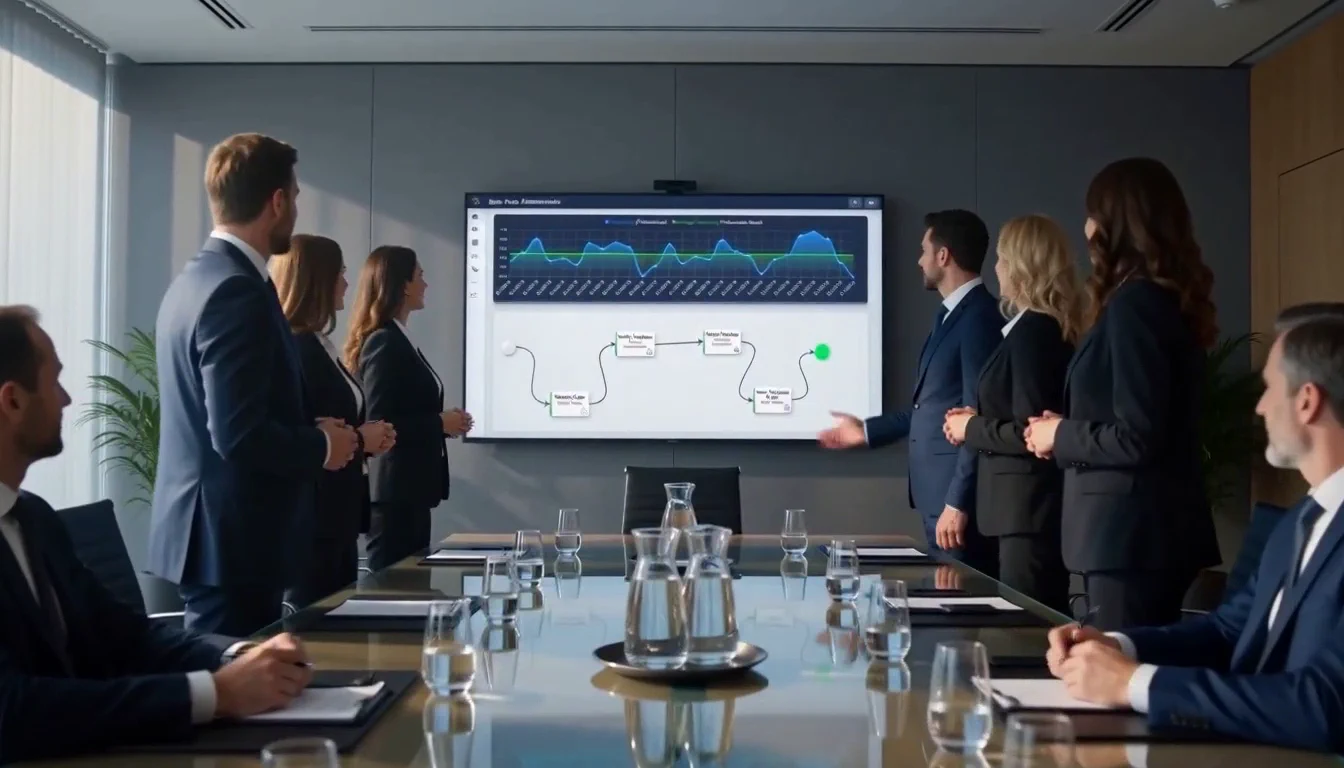
Put operational insight to work. Harpia connects process effort, capacity, and technology so leaders can prioritize improvements and measure their impact.
HARPIA / THE PLATFORM
01–06 / CORE BENEFITS
See how work gets done.
Understand how teams spend time across spreadsheets, ERP, CRM, and meeting tools in near real time.
Put a cost on effort.
See how much time each process takes, estimate the staffing it requires in FTEs, and translate that effort into cost.
Identify work worth automating.
Use time and activity data to find recurring steps where automation or AI could free up capacity.
Direct resources to the bottleneck.
Compare process redesign, staffing, and technology investments by the operational constraints they address.
Equip teams for the work ahead.
Review hardware, software, and device performance to identify policy gaps and prioritize replacements.
Verify what changed.
Compare effort and performance before and after an investment to see whether it delivered the expected gains.
Connect the time teams spend, the tools they use, and the cost of each process to make better investment decisions.
See where time goes across spreadsheets, ERP, CRM, and meetings as teams carry out their daily work.
Talk to an expertTrace steps and handoffs to see where work slows down or gets repeated.
Understand which tools each team relies on and how much time they spend in them.
Estimate the staffing and time each process requires by department.
Find recurring steps where automation could free up time, and size the opportunity before investing.
Compare process redesign, staffing, and technology using the time and cost each option addresses.
Compare effort and performance before and after a change to see what improved.
Check hardware, software, and performance against IT policies, and identify devices due for an upgrade.
HARPIA / CONTACT
Tell us which process or investment decision you’re working on. We’ll discuss how Harpia can give you the detail you need.